The Best Connected States in America. Ranking Gigabit & 5G Access.


When you buy through our links, we may earn an affiliate commission.
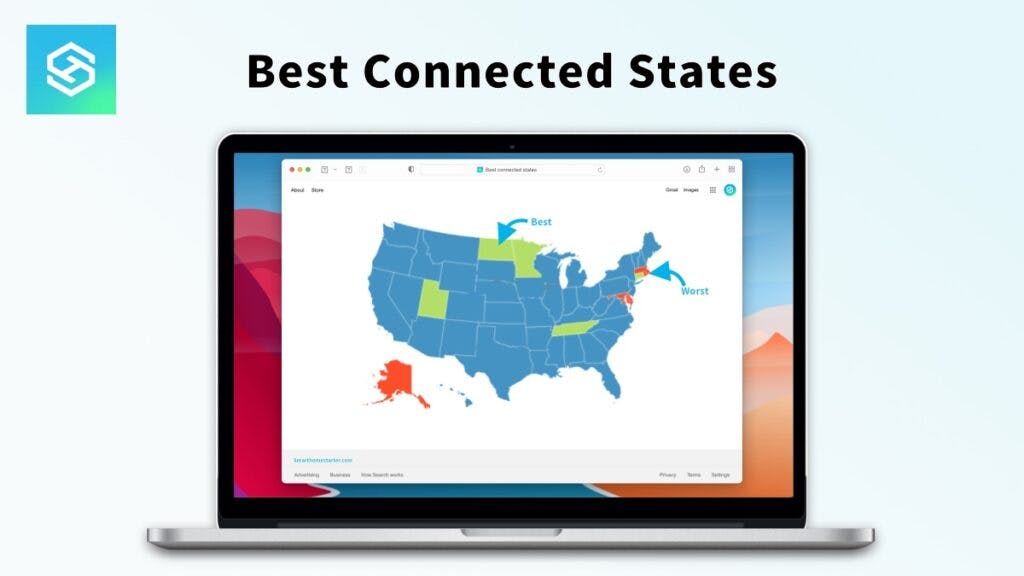
New research has revealed that North Dakota and New Jersey are the best connected states in America.
Our study analyzed FCC data on broadband and mobile internet speeds and availability in each state, to discover where has the widest availability of gigabit speed internet, and 5G speeds of at least 35 Mbps.
North Dakota tops the list as the state with the widest availability of fixed broadband providing download speeds of at least 1,000 megabits per second. The FCC data shows that gigabit speed internet is available to 60.58% of residential locations in the state – the highest percentage in the nation. Data from the US Census Bureau reveals that the average North Dakotan household’s annual expenditure on phone services is $1,670.25, which is nine dollars less than the national average ($1,679.96), indicating they are getting good value for money when it comes to fixed broadband speeds.
Minnesota has the second highest availability of gigabit broadband speeds with coverage for 60.41% of residential locations. However the average annual bill for phone services in the state is higher than in North Dakota, at $1,840.70.
Tennessee places third for residential access to ultrafast broadband – 48.28% of properties can get it, and the state’s average annual spend on phone services is fairly low too, at $1,544.13.
When it comes to mobile broadband, New Jersey has the best access to 5G speeds of at least 35 megabits per second. The FCC data shows that the speeds are available in 58.58% of the area when in an outdoor stationary environment. However New Jersey residents should expect to top the list for connectivity, as the average annual expenditure for a household on phone services is the highest in the country, at $2,142.45. Meanwhile the availability of gigabit speed internet is also fairly low, with only 18.6% of residential properties able to access it.
Delaware is the second best state for 5G cellular coverage, with speeds of at least 35mbps available across 58.32% of areas. In contrast it has the second lowest availability of broadband with speeds of 1,000mbps or more – only 0.02% of the state can access such speeds.
Connecticut ranks third for 5G coverage, on 49.15%, while Maryland (48.88%), and Indiana (47.02%) complete the top five.
This data offers a fascinating insight into the nation’s connectivity. As society becomes ever more reliant on the internet, the importance of good fixed and mobile broadband infrastructure becomes increasingly important. Many people want to fully embrace the benefits that the internet can bring, whether that is upgrading their home with smart tech, enjoying instant high quality entertainment, or taking their business to the next level, and this data shows that those things are more accessible in some states than in others.
The data also revealed that in 48 out of 50 states, at least 97% of residential locations have access to broadband speeds of at least 50mbps. The two outliers are Hawaii, where 90.34% of locations can access those speeds, and Alaska where just 77.6% can. This is despite the fact that the states have the 11th and 12th highest average household expenditure on phone services, at $1,878.25 for Alaska, and $1,872.47 for Hawaii.
There are five states where speeds of at least 250mbps are available to 100% of residences: Connecticut, Utah, Rhode Island, Wyoming and South Dakota.
Top 10 states ranked by calculated percentage of units for broadband serviceable locations contained within the geography for which providers report residential fixed broadband service with any technology and speeds of at least 1000 / 10 Mbps
| Rank | State | Percentage of units | Estimated consumer expenditures per household on phone services |
| 1 | North Dakota | 60.58% | $1,670.25 |
| 2 | Minnesota | 60.41% | $1,840.70 |
| 3 | Tennessee | 48.28% | $1,544.13 |
| 4 | Utah | 48.25% | $1,799.68 |
| 5 | Connecticut | 44.61% | $2,025.10 |
| 6 | Texas | 43.96% | $1,763.09 |
| 7 | Nebraska | 43.52% | $1,606.28 |
| 8 | Kentucky | 42.52% | $1,437.29 |
| 9 | Kansas | 40.74% | $1,610.68 |
| 10 | Indiana | 39.94% | $1,509.04 |
Top 10 states ranked by calculated percentage of area within the geography for which providers report 5G-NR mobile broadband service with speeds of at least 35 / 3 Mbps in an outdoor stationary environment.
| Rank | State | Percentage of area | Estimated consumer expenditures per household on phone services |
| 1 | New Jersey | 58.58% | $2,142.45 |
| 2 | Delaware | 58.32% | $1,740.57 |
| 3 | Connecticut | 49.15% | $2,025.10 |
| 4 | Maryland | 48.88% | $2,127.90 |
| 5 | Indiana | 47.02% | $1,509.04 |
| 6 | Ohio | 46.69% | $1,541.62 |
| 7 | Illinois | 44.30% | $1,800.01 |
| 8 | Rhode Island | 42.01% | $1,685.51 |
| 9 | Pennsylvania | 41.63% | $1,673.40 |
| 10 | Massachusetts | 41.21% | $2,116.09 |